Computes and plot the cosine similarity of each individual signature is computed against each COSMIC signature from COMIC V3.2
Source:R/generateCOSMICSignaturePlot.R
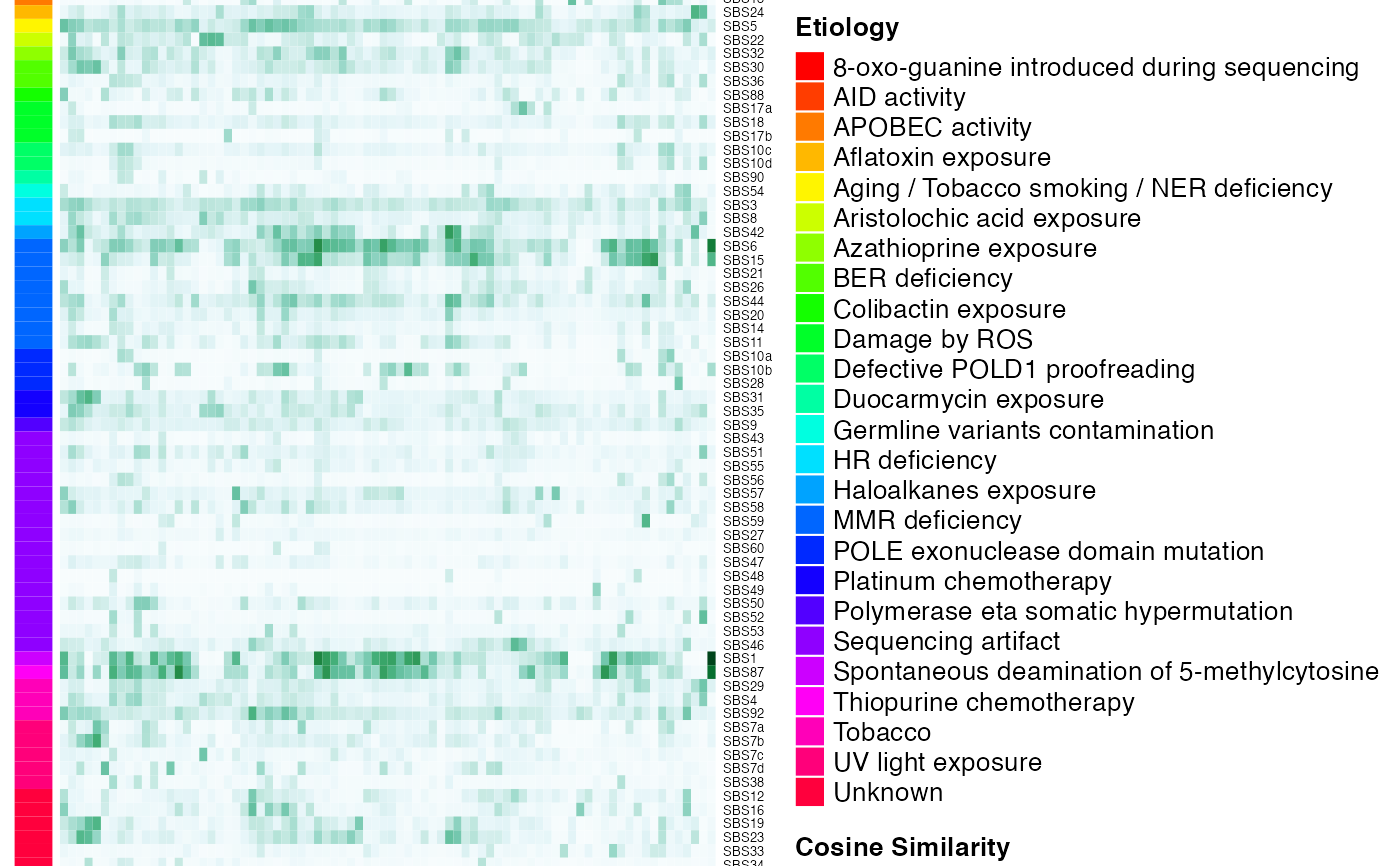
generateCOSMICMutSigSimHeatmap.RdThis function computes and plot the cosine similarity of each individual signature is computed against each COSMIC signature from COMIC V3.2. The cosine similarity is a value between 0 (distinct) and 1 (identical) and indicates how much two vectors are alike.
generateCOSMICMutSigSimHeatmap(
  mymaf,
  use_silent_mutations = FALSE,
  full_output = FALSE,
  show_broad_categories = TRUE,
  clin_data = NULL,
  clin_data_colors = NULL,
  add_sample_names = NULL,
  savename = NULL,
  fig_height = NULL,
  fig_width = NULL
)
Arguments
- mymaf
mutation count matrix (dimensions: a mutation features X n samples)
- use_silent_mutations
96 mutation count matrix (dimensions: a mutation features X m samples)
- full_output
return full output including the etiology matrix and plot data
- show_broad_categories
To show broad etiology categories
- clin_data
Clinical data to be plotted in the heatmap
- clin_data_colors
Clinical data colors
- add_sample_names
Whether or not to add column labels; if set to NULL, will add labels only if # samples less than 10
- savename
file name of the plot
- fig_height
Output height (inches); set to NULL to size automatically; only used if savename is set.
- fig_width
Output width (inches); set to NULL to size automatically; only used if savename is set.
Value
Complex Heatmap object. If full_output is TRUE it will consist of a list including heatmap object, etiology matrix and plot data.
Examples
library(MAFDash)
library(maftools)
library(ComplexHeatmap)
#> Loading required package: grid
#> ========================================
#> ComplexHeatmap version 2.6.2
#> Bioconductor page: http://bioconductor.org/packages/ComplexHeatmap/
#> Github page: https://github.com/jokergoo/ComplexHeatmap
#> Documentation: http://jokergoo.github.io/ComplexHeatmap-reference
#>
#> If you use it in published research, please cite:
#> Gu, Z. Complex heatmaps reveal patterns and correlations in multidimensional
#>   genomic data. Bioinformatics 2016.
#>
#> This message can be suppressed by:
#>   suppressPackageStartupMessages(library(ComplexHeatmap))
#> ========================================
maf <- system.file("extdata", "test.mutect2.maf.gz", package = "MAFDash")
val<-generateCOSMICMutSigSimHeatmap(read.maf(maf));draw(val)
#> -Reading
#> -Validating
#> -Silent variants: 561
#> -Summarizing
#> --Possible FLAGS among top ten genes:
#>   MACF1
#>   MUC16
#> -Processing clinical data
#> --Missing clinical data
#> -Finished in 0.244s elapsed (0.220s cpu)
#>
#> Attaching package: ‘BiocGenerics’
#> The following objects are masked from ‘package:parallel’:
#>
#>     clusterApply, clusterApplyLB, clusterCall, clusterEvalQ,
#>     clusterExport, clusterMap, parApply, parCapply, parLapply,
#>     parLapplyLB, parRapply, parSapply, parSapplyLB
#> The following objects are masked from ‘package:stats’:
#>
#>     IQR, mad, sd, var, xtabs
#> The following objects are masked from ‘package:base’:
#>
#>     Filter, Find, Map, Position, Reduce, anyDuplicated, append,
#>     as.data.frame, basename, cbind, colnames, dirname, do.call,
#>     duplicated, eval, evalq, get, grep, grepl, intersect, is.unsorted,
#>     lapply, mapply, match, mget, order, paste, pmax, pmax.int, pmin,
#>     pmin.int, rank, rbind, rownames, sapply, setdiff, sort, table,
#>     tapply, union, unique, unsplit, which.max, which.min
#>
#> Attaching package: ‘S4Vectors’
#> The following object is masked from ‘package:base’:
#>
#>     expand.grid
#>
#> Attaching package: ‘Biostrings’
#> The following object is masked from ‘package:base’:
#>
#>     strsplit
#> -Extracting 5' and 3' adjacent bases
#> -Extracting +/- 20bp around mutated bases for background C>T estimation
#> -Estimating APOBEC enrichment scores
#> --Performing one-way Fisher's test for APOBEC enrichment
#> ---APOBEC related mutations are enriched in  12.658 % of samples (APOBEC enrichment score > 2 ;  10  of  79  samples)
#> -Creating mutation matrix
#> --matrix of dimension 80x96