This function created an HTML file containing the different figures and plots explaining the MAF dataset.
generateOncoPlot(
  maf,
  cohort_freq_thresh = 0.01,
  auto_adjust_cohort_freq = TRUE,
  genes_to_plot = NULL,
  include_all = FALSE,
  oncomat_only = FALSE,
  title_text = "",
  custom_column_order = NULL,
  add_clinical_annotations = FALSE,
  clin_data_colors = NULL
)
Arguments
- maf
The MAF object
- cohort_freq_thresh
Fraction of cohort that a gene must be mutated to select for display
- auto_adjust_cohort_freq
Whether or not to automatically adjust the frequen
- genes_to_plot
Character vector, data frame, or tab-delimited file name with genes to plot. Data frame or file should contain a column named "Hugo_Symbol" with gene symbols, and optionally, a column named "Reason" for labeling the plot
- include_all
Flag to include all the samples including the missing one (Default: FALSE)
- oncomat_only
Whether or not to return just the oncoplot matrix
- title_text
The title of the plot
- custom_column_order
A list containing the order of samples to show in the plot (Optional)
- add_clinical_annotations
Whether or not to try to plot column annotations from the 'clinical.data' slot of the MAF object
- clin_data_colors
Named list of colors for clinical annoations
Value
A ComplexHeatmap object if 'oncomat_only' is FALSE or a character matrix if 'oncomat_only' is TRUE.
Examples
library(MAFDash)
library(maftools)
maf <- system.file("extdata", "test.mutect2.maf.gz", package = "MAFDash")
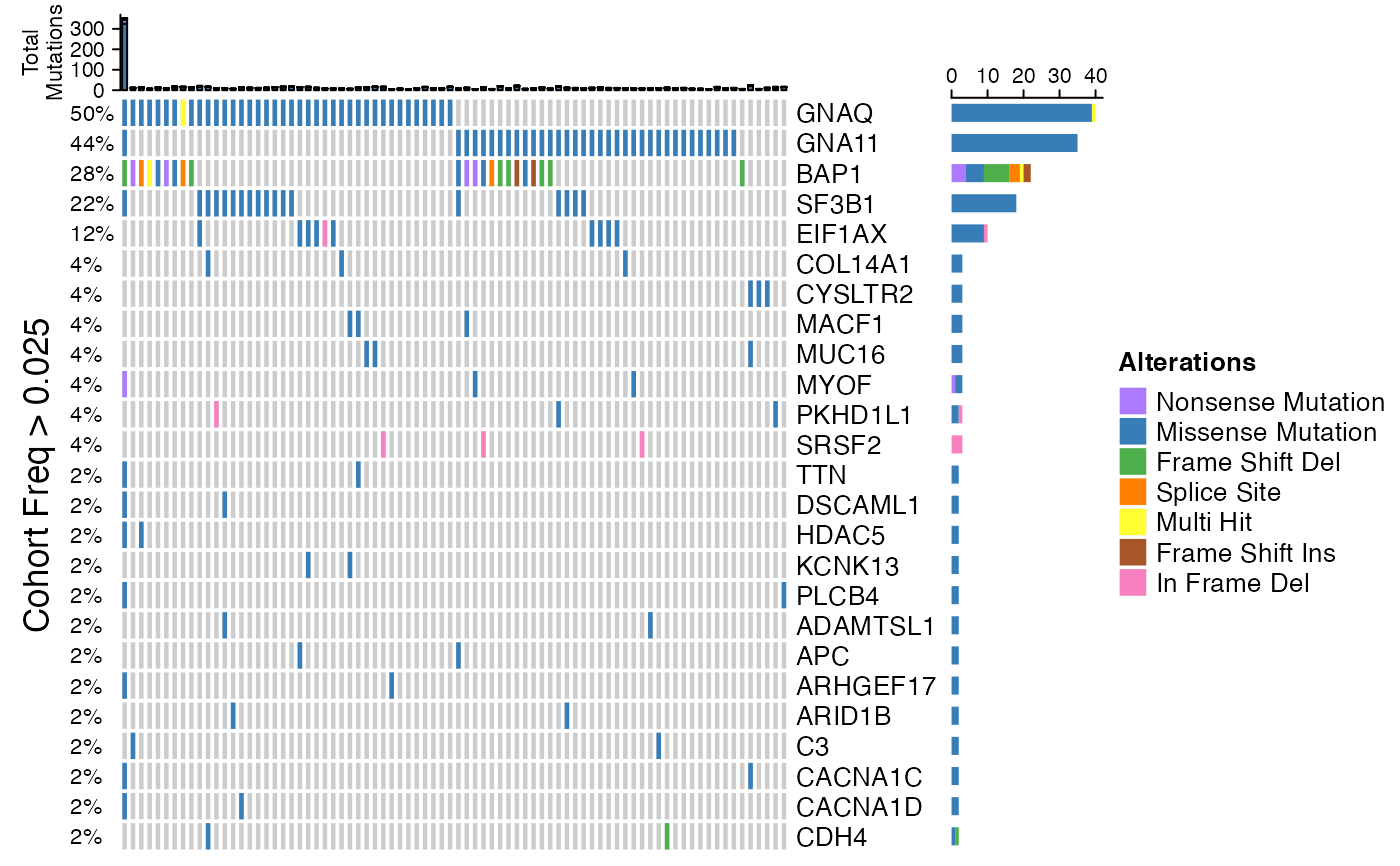
generateOncoPlot(read.maf(maf))
#> -Reading
#> -Validating
#> -Silent variants: 561
#> -Summarizing
#> --Possible FLAGS among top ten genes:
#> MACF1
#> MUC16
#> -Processing clinical data
#> --Missing clinical data
#> -Finished in 0.337s elapsed (0.305s cpu)
#> All mutation types: Missense Mutation, Frame Shift Del, Nonsense
#> Mutation, Splice Site, Multi Hit, In Frame Del, Frame Shift Ins.
#> `alter_fun` is assumed vectorizable. If it does not generate correct
#> plot, please set `alter_fun_is_vectorized = FALSE` in `oncoPrint()`.