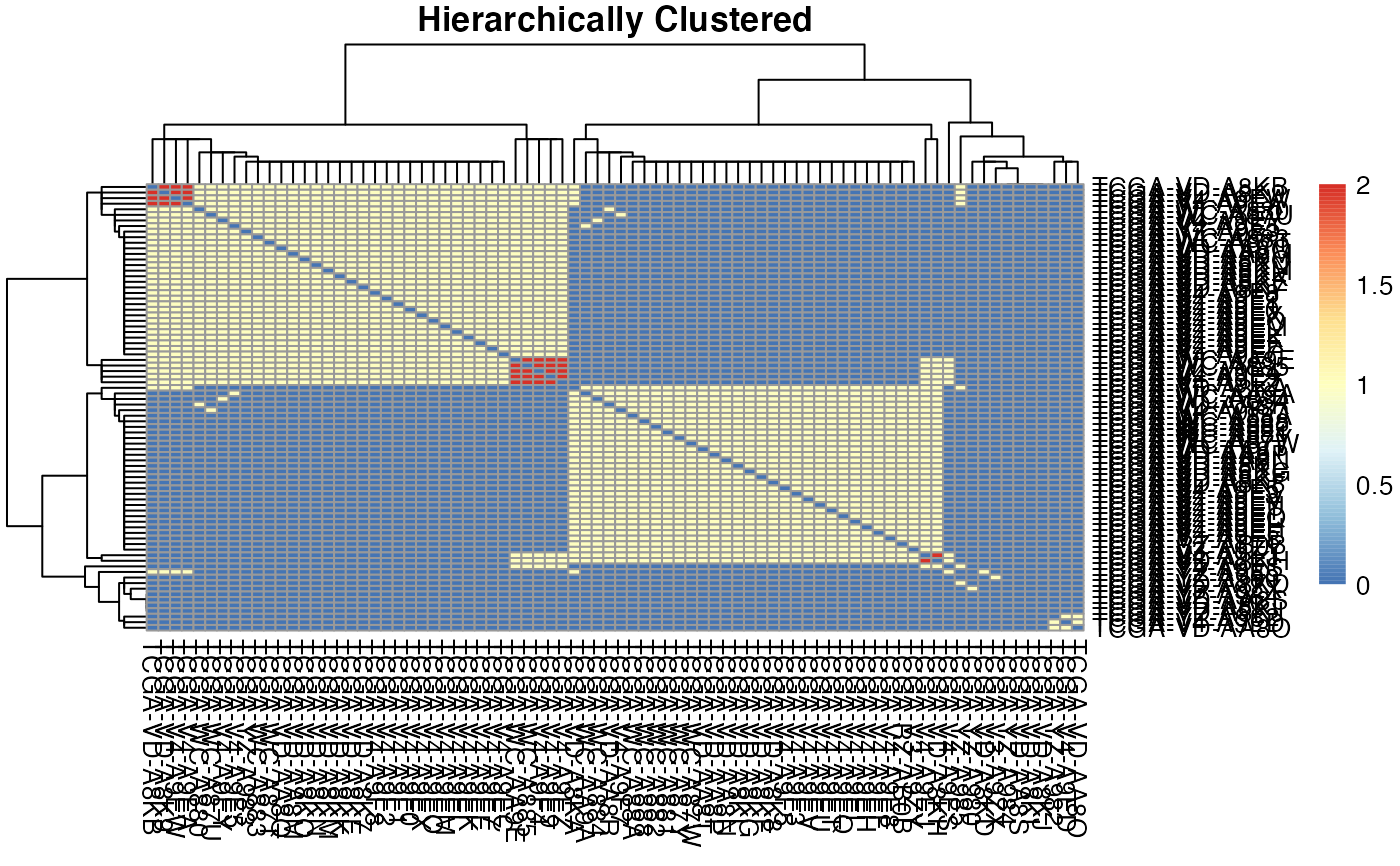
This function generates an overlap plot using the MAF data.
generateOverlapPlot(
  mymaf,
  use_silent_mutations = FALSE,
  summarize_by = "gene",
  plotType = c("ribbon", "heatmap"),
  savename = NULL,
  savewidth = 8,
  saveheight = 8
)
Arguments
- mymaf
The MAF object
- use_silent_mutations
Flag to use the silent mutations in the plot
- summarize_by
Paramter to summarize the data (Either 'gene' or 'mutation'")
- plotType
The type of plot generated ("ribbon" or "heatmap" or both)
- savename
The name and path of the output file
- savewidth
Width of plot
- saveheight
Height of plot
Value
No return value, the plot is saved as a pdf
Examples
library(MAFDash)
library(maftools)
maf <- system.file("extdata", "test.mutect2.maf.gz", package = "MAFDash")
generateOverlapPlot(read.maf(maf))
#> -Reading
#> -Validating
#> -Silent variants: 561
#> -Summarizing
#> --Possible FLAGS among top ten genes:
#>   MACF1
#>   MUC16
#> -Processing clinical data
#> --Missing clinical data
#> -Finished in 0.211s elapsed (0.195s cpu)