Function to generate a ribbon plot depicting co-occurence and mutual exclusivity of gene mutations
Source:R/generateSingleRibbonPlot.R
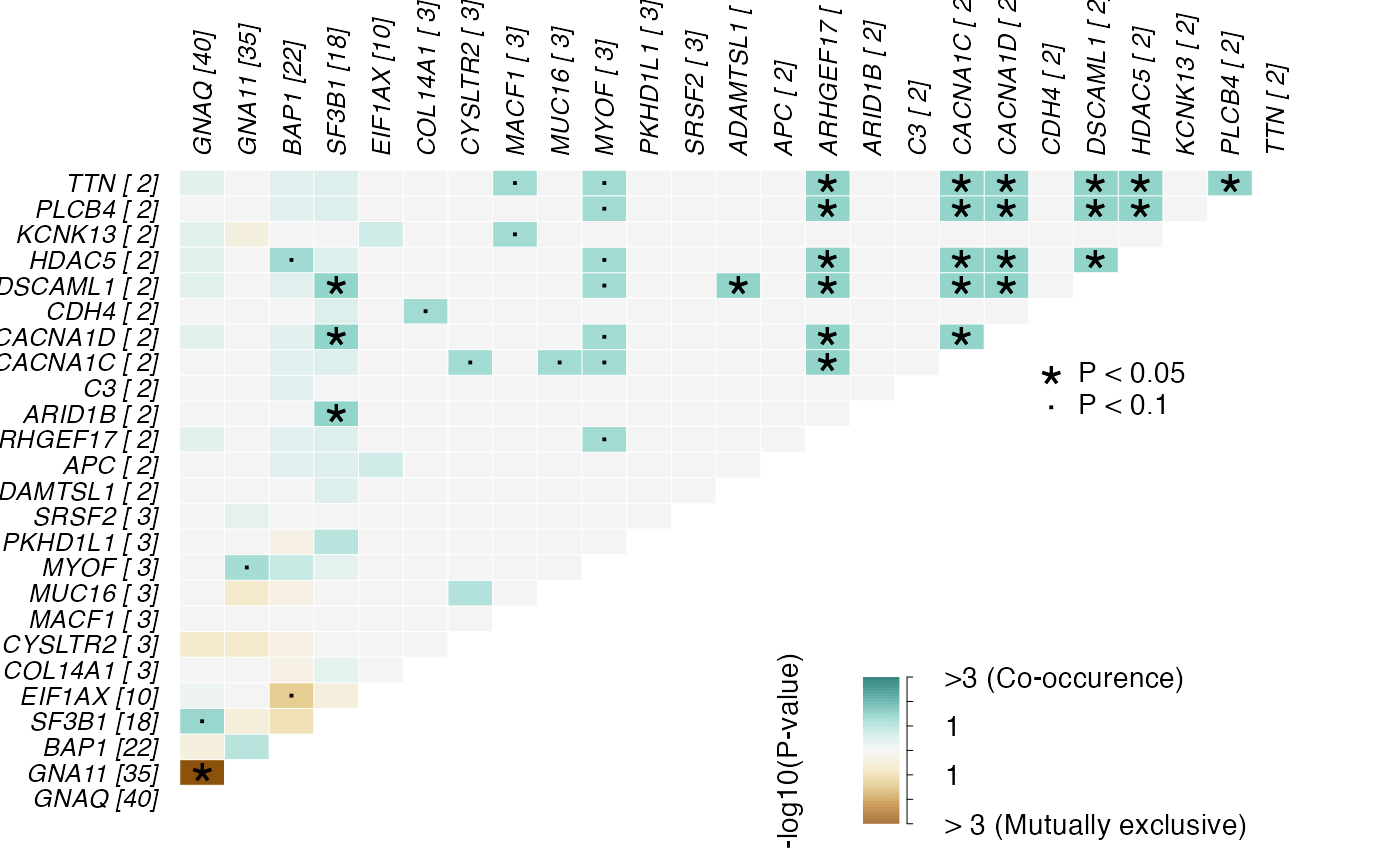
generateRibbonPlot.RdThis function provides an alternate visualization for maftools::somaticInteractions()
generateRibbonPlot(
  maf,
  onco_genes = NULL,
  save_name = NULL,
  pval_high = 0.1,
  pval_low = 0.05,
  plot_type = "matrix",
  plot_frac_mut_axis = TRUE,
  rotate_plot_degrees = 0,
  shrink_factor = 1.3,
  scale_ribbon_to_fracmut = TRUE,
  sig_colors = NULL,
  gene_colors = NULL
)
Arguments
- maf
A MAF object
- onco_genes
A list of genes to restrict the analysis. Passed to maftools::somaticInteractions()
- save_name
The name and path of the output PDF
- pval_high
All interactions with less than this p-value will be shown
- pval_low
Links with p-value less than this will be shown in a darker color
- plot_type
'ribbon' returns a customized chord diagram, 'matrix' returns the default somaticInteractions() plot
- plot_frac_mut_axis
Whether or not to draw a numerical axis on the perimeter
- rotate_plot_degrees
Rotate default layout by this many degrees
- shrink_factor
Higher values = more shrinkage; use to control whitespace (or lack thereof) around figure. Mostly useful in 0.5 - 1.5 range.
- scale_ribbon_to_fracmut
Whether or not to scale ribbon widths to their frequency
- sig_colors
Vector of 4 colors for coloring significance
- gene_colors
Color(s) for gene segments. By default, they're colored randomly.
Value
No return value. If 'save_name' is not provided, then the plot is printed to the current graphics device, otherwise a PDF is created at the given path.
Examples
library(MAFDash)
library(maftools)
maf <- system.file("extdata", "test.mutect2.maf.gz", package = "MAFDash")
generateRibbonPlot(read.maf(maf),save_name=paste0(tempdir(),"/ribbonPlot.pdf"))
#> -Reading
#> -Validating
#> -Silent variants: 561
#> -Summarizing
#> --Possible FLAGS among top ten genes:
#>   MACF1
#>   MUC16
#> -Processing clinical data
#> --Missing clinical data
#> -Finished in 0.218s elapsed (0.199s cpu)